Our Mission
Our mission is to advance the education of the public in the subjects of evolution, biodiversity and conservation of the variety of life on earth. We are a not for profit organisation registered in the UK.
Our Software
OneZoom version 4.1-154-gf7ba1371
The OneZoom software allows you to explore the tree of life in a completely new way that is similar to viewing a geographical map. This is done using techniques from a branch of mathematics known as fractal geometry, which enable us to condense the entire tree of life into a single page. OneZoom is so named because all the information is on one page, all you have to do is zoom to reveal further details.
We hope you have fun exploring the OneZoom tree of life. We've certainly had fun developing it, even after many thousands of hours working with OneZoom, we are still frequently astonished at what it reveals about the world around us. Most of our source code is publicly viewable enabling interested developers and scientists to contribute improvements if they wish.
OneZoom Organisation
OneZoom is a charitable incorporated organisation (non-profit) registered under number 1163559 in the UK. We aim to provide easy access to scientific knowledge about biodiversity and evolution, and raise awareness about the variety of life on earth together with the need to conserve it. In pursuit of these aims, our current focus is on developing this visualization of the tree of life. Our registered address is OneZoom, Office 7, 35-37 Ludgate Hill, London, EC4M 7JN, UK.The OneZoom project has a long history of development dating back to the first version of OneZoom that was conceived in 2011 and released under an open source license in 2012. The OneZoom codebase is now improved and maintained by the OneZoom charitable organisation since the charity's formation in 2015.
Our collaborators

OneZoom is delighted to be in collaboration with the Linnean Society of London since 2017.
![]()
OneZoom is delighted to be a partner of the One Tree, One Planet project since 2017.
Equality, diversity and accessibility
OneZoom is committed to the principles of equality and diversity. We will not discriminate on the basis of age, disability, gender, gender reassignment, race, religion or sexual orientation. Our educational materials are open to everyone and we are taking steps to increase their accessibility as much as is practical for a project of our size. Recent steps include a colour blind friendly mode for our main tree of life explorer and addition of an 'Mx' title on our sponsorship page for individuals with non-binary gender identity. We welcome all feedback on how we can make our work more accessible.
Funding and sponsorship
![]()
We thank On the Edge for funding the introduction of our tree tours feature with a grant of £25,000 made in 2022.
We thank everyone who supported us by sponsoring leaves on our tree of life, this source of income has enabled us to build and maintain the website you see today.
We are especially grateful to Prof. Richard Dawkins and Prof. Jonathan Drori who have been most generous with their donations for sponsorship.
OneZoom still needs funding, our unique and important work falls between the cracks of mainstream funding opportuinities.
You can support us through sponoring a leaf, choose a leaf by clicking on it in the tree of life explorer, or through the sponsorship page on our website.
We are also hoping to attract the interest of private foundations and other organisations whose goals align with ours please contact us, if you are aware of any opportuinities that could support OneZoom.How to cite OneZoom
If you've used OneZoom in teaching or research and you want to cite the project please use
OneZoom Core Team (2026). OneZoom Tree of Life Explorer Version 4.1-154-gf7ba1371 URL: http://www.onezoom.org
We also appreciate citations of our scientific publications about OneZoom development
- Yan Wong and James Rosindell (2021) Dynamic visualisation of million-tip trees: the OneZoom project. Methods in Ecology and Evolution 00: 1–11. doi: 10.1111/2041-210X.13766
- James Rosindell and Yan Wong (2018) Biodiversity, the Tree of Life, and Science Communication in Phylogenetic Diversity eds. Rosa A. Scherson and Daniel P Faith
- James Rosindell and Luke Harmon (2012) OneZoom: A Fractal Explorer for the Tree of Life. PLoS Biology 10: e1001406. doi: 10.1371/journal.pbio.1001406
Other references
The data used to construct the main tree on this site is from a hand-crafted mix of sources, but relies heavily on the Open Tree of Life project, to whom we are extremely grateful.
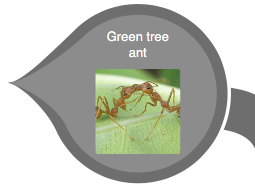
Images of species on the tree have been harvested from the internet by the Encyclopedia of Life project (EoL). We must thank EoL for their fantastic resource, and helpful responses to our various requests. For further information on any image, zoom into the copyright symbol next to the picture, the symbol may also serve as a link to the source of the image.
In the current version, red leaves of the tree correspond to species that are threatened with extinction according to the IUCN Red List of threatened species.
The fractal layout for our ‘polytomy’ tree view, also used by the One Tree One Planet Project, is similar to and draws some inspiration from Lifemap: Exploring the Entire Tree of Life PLoS Biol 14(12): e2001624 (2016) by Damien M de Vienne.
People and credits
Please see our Team page team page for a full list of current and past OneZoom team members
We thank Jamie Lentin for his huge input into the OneZoom codebase and especially for development of version 3.3 to support the One Tree One Planet Project.
We thank Kai Zhong for his huge input into the OneZoom codebase and especially for code refactoring and the addition of dynamic caching to enable the complete tree of life to be displayed.
We thank the entire One Tree One Planet project team for their support in developing OneZoom further to make it suitable to use as part of One Tree One Planet: Naziha Mestaoui, Douglas Soltis, Pamela Soltis, Robert Guralnick and Matt Gitzendanner
We thank the Linnean Society of London for their support as a collaborator, for hosting OneZoom at numerous events, and for promoting the Linnean Society Tree on OneZoom.
We thank Jonathan Sutton for his significant contribution to the OneZoom codebase during his 2016 summer placement.
We thank Hélène Morlon for her support in promoting and developing the OneZoom project since she joined the team in 2016.
We thank Jonathan Drori for his advice and support in running the OneZoom charitable organisation.
We thank Prof. Richard Dawkins and Prof. Alice Roberts for their kind ongoing promotion of OneZoom at events and on social media.
We thank Prof. Duncan Gillies who assisted James in the supervision and recruitment of Kai Zhong.
We would also like to thank the following people (in alphabetical order) for providing a wide range of help and advice at various stages in the OneZoom project history: Austin Burt, Joseph Brown, Noah Constant, Stephen Cornell, Joel Cracraft, Mick Crawley, Jonathan Eastman, Rampal Etienne, Robert Ewers, Rich FitzJohn, James Foster, Matt Gitzendanner, Mark Hammond, Lisa Harmon, Michelle Harrison, Klaas Hartmann, Jacob Hepworth-Bell, David Hillis, Nick Isaac, Sean Jordan, Walter Jetz, Jeff Joy, James Keirstead, Mike Kiparsky, Bill Kunin, Simon Levey, Curtis Lisle, Georgina Mace, Catriona MacCallum, Lynsey McInnes, Arne Mooers, Jack Nijjar, Laura Nunes, David Orme, Guillermo Orti, Ian Owens, Rod Page, Matishalin Patel, William Pearse, Matt Pennell, Albert Phillimore, Jacqueline Phillimore, Andy Purvis, Alex Pyron, Donald Quicke, Erica Bree Rosenblum, Jill Rosindell, Owen Rosindell, Martin Sayers, Nilay Shah, Graham Slater, Doug Soltis, Matthew Speight, David Tank, Gavin Thomas, Nina Thornhill, Oliver Worsfold, Amy Zanne
All versions of the OneZoom software from 2.0 upwards were developed jointly by Dr. James Rosindell, who primarily worked on visualisation and Dr. Yan Wong, who primarily worked on synthesising the tree data. Yan is a coauthor with Professor Richard Dawkins on The Ancestor’s Tale: a history of life, which has made extensive use of the OneZoom visualisations. The research done for the book has in turn contributed to the dataset used by the OneZoom software.
James originally devised the OneZoom concept in 2011, he initially worked on the project only during his spare time, taking advice from Luke Harmon in particular. After that, James further developed OneZoom as part of his research program at Imperial College London, which was funded by a research fellowship from the (NERC). The first version 1.0 of the software and an associated academic paper authored by James and Luke was published in 2012. All ongoing OneZoom activities have been managed by the independent OneZoom charity since its formation in 2015.
 Mammals: the entire tree is from Bininda-Emonds et al. (2007) The delayed rise of present-day mammals (
 Marsupials: orders arranged according to Nilsson et al. (2010) Tracking Marsupial Evolution Using Archaic Genomic Retroposon Insertions (
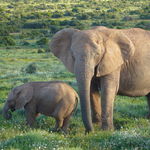 Placental mammals: afrotheres and xenarthrans are grouped together (the
 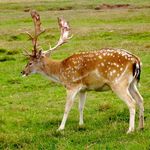 Cetartiodactyla: placement is taken from dos Reis et al. (2012) Phylogenomic datasets provide both precision and accuracy in estimating the timescale of placental mammal phylogeny (
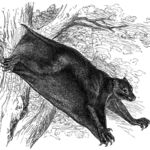 Colugos from Janečka et al. (2008) Evidence for multiple species of Sunda colugo (
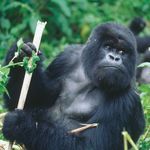 Primates: entire tree from Springer et al. (2012) Macroevolutionary dynamics and historical biogeography of primate diversification inferred from a species supermatrix (
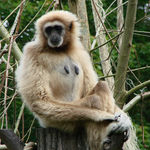 Gibbons: arrangements of the 4 genera taken from Carbone et al. (2014) Gibbon genome and the fast karyotype evolution of small apes (
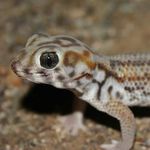 Sauropsids (lizards, snakes, crocodiles, birds, turtles):
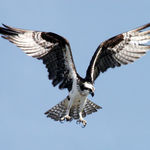 Birds: entire tree from Jetz et al. (2012) The global diversity of birds in space and time (
 Snakes & lizards: arrangement and divergence dates of Gekkota, Xantusiidae, Gerrhosauridae, Cordylidae, Scincidae, Lacertoidea, Anguimorpha, Acrodonta, Pleurodonta, Serpentes, and species-level taxonomy of Sphenodon and Dibamus from Zheng & Wiens (2016) Combining phylogenomic and supermatrix approaches, and a time-calibrated phylogeny for squamate reptiles (lizards and snakes) based on 52 genes and 4162 species (
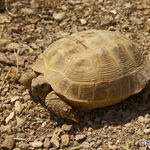 Turtles: entire tree from Jaffe et al. (2011) The evolution of island gigantism and body size variation in tortoises and turtles (
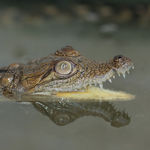 Crocodiles: entire tree from Oaks (2011) A time-calibrated species tree of crocodylia reveals a recent radiation of the true crocodiles (
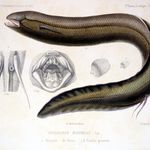
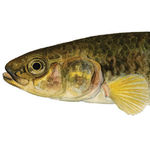 Ray-finned fish: backbone from
  Sturgeons: entire tree from Krieger et al. (2008) The molecular phylogeny of the order Acipenseriformes revisited (
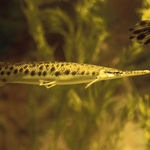 Gars: all species from Deepfin 3, with Atractosteus tristoechus added from from Wright et al. (2012) Gene trees, species trees, and morphology converge on a similar phylogeny of living gars (Actinopterygii: Holostei: Lepisosteidae), an ancient clade of ray-finned fishes (
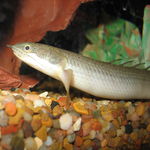 Bichirs from Suzuki et al. (2010) The mitochondrial phylogeny of an ancient lineage of ray-finned fishes (Polypteridae) with implications for the evolution of body elongation, pelvic fin loss, and craniofacial morphology in Osteichthyes (
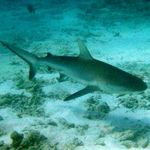 Sharks, Rays, & Chimeras (cartilagenous fish): see the
 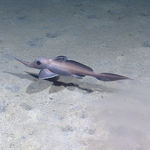 Chimaeras: arrangement of 6 major groups from Inoue et al. (2010) Evolutionary Origin and Phylogeny of the Modern Holocephalans (Chondrichthyes: Chimaeriformes): A Mitogenomic Perspective (
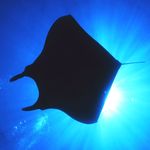 Skates & Rays: arrangement of 16 higher-level groups from Aschliman et al. (2012) Body plan convergence in the evolution of skates and rays (Chondrichthyes: Batoidea) (
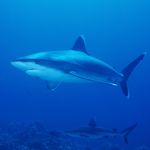 Sharks: relationships between genera (also within genera for Etmopteridae, Pristiophoridae, and Atelomycterus) primarily based on Naylor et al. (2012) Elasmobranch Phylogeny: A Mitochondrial Estimate Based on 595 Species (
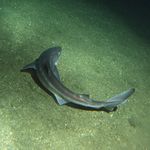 Squaliform (deep sea) shark phylogeny from Straube et al. (2015) Molecular phylogeny of Squaliformes and first occurrence of bioluminescence in sharks (
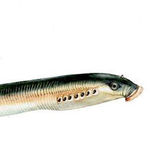
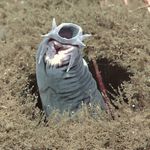 Hagfishes: arrangement of genera from a combination of the 3 trees in Fernholm et al. (2013) Hagfish phylogeny and taxonomy, with description of the new genus Rubicundus (Craniata, Myxinidae) (
 Lampreys: entire tree from figure 2.6 of Potter et al. (2015) The Taxonomy, Phylogeny, and Distribution of Lampreys (
 The relationships between Echinozoa (sea urchins & sea cucumbers), Ophiuroidea (brittle stars), Asteroidea (starfish), and Crinoidea (sea lilies) is resolved on the basis of Pisani et al. (2012) Resolving phylogenetic signal from noise when divergence is rapid: A new look at the old problem of echinoderm class relationships (
 Protosomes: apart from the arrow worms, the protostomes are now commonly believed to fall into two major groups, the Ecdysozoa and the another group which sometimes gets called Lophotrochozoa or Spiralia. Within these two groups:
 Ecdysozoa (insects, and their wider relatives) now have a reasonably well established evolutionary tree.
  The Onychophora (velvet worms) are probably closest relatives of the arthropods (crustaceans, insects, spiders, centipedes, etc), as argued by Campbell et al. (2011) MicroRNAs and phylogenomics resolve the relationships of Tardigrada and suggest that velvet worms are the sister group of Arthropoda (
 Edgecombe et al. (2011) also group the parasitic Nematomorpha (horsehair worms) with Nematoda (nematode worms). Advice from taxonomists leads us to place this as the sister to the panarthropods
 Scalidophora (a group of tiny obscure phyla) are left as the only remaining Ecdysozoans, hence the deepest Ecdysozoan split is between them and everything else. Note that this is arguable. For instance, Scalidophora are placed as sister to nematomorpha/nematoda by Dunn et al. (2008) Broad phylogenomic sampling improves resolution of the animal tree of life
  Spiralia (molluscs, segmented worms, and much more) — also known as Lophotrochozoa. The relationships between these animals is one of the trickiest in the entire tree. We mostly follow a recent review by Kocot (2016) On 20 years of Lophotrochozoa (
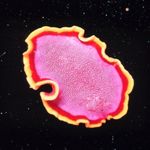 Gnathifera, Gastrotricha and Platyhelminthes: Gnathifera is a collection of three very small, often wormy creatures, including the rotifers, which is sometimes placed with the flatworms (platyhelminths) and gastrotrichs in a group known as the
 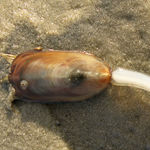 Bryozoans (moss animals), phoronids (horseshoe worms), and brachiopods are now often found joined together in molecular studies, forming a group known as the lophophorates (see Nesnidal et al., (2013) New phylogenomic data support the monophyly of Lophophorata and an Ectoproct-Phoronid clade and indicate that Polyzoa and Kryptrochozoa are caused by systematic bias.
 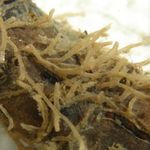 Entoprocta (~150 species of minute aquatic filter feeders) and Cycliophora (2 or 3 species of sac-like animals that live exclusively on lobster mouthparts) are often grouped together in molecular studies. Kocot very tentatively suggests that this group could be within the lophophorates, as sister to the bryozoans, in line with morphological studies that suggest these three phyla form a higher level group called the Polyzoa. Until a better suggestion comes along, we follow this (rather unsubstantiated) suggestion.
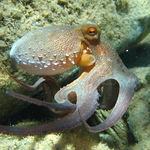 The ribbon worms, segmented worms (annelids, e.g. earthworms) and molluscs are grouped by Edgecombe et al. with the lophophorates, in a larger band called Trochozoa. This grouping is also backed by Laumer et al. and Kocot. For the relationships between these four groups, we follow Laumer et al. in placing the basal divergence between molluscs and the rest, followed by a divergence between annelids and the remaining two. This particular arrangement is, however, extremely tentative.
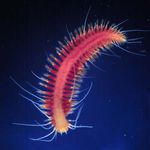 Within the segmented worms, relationships have been taken from Weigert & Bleidorn (2016) Current status of annelid phylogeny (
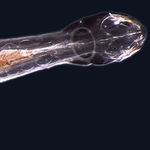 Finally, the planktonic arrow worms (chaetognaths) are a perennial bugbear, but are considered by nearly all biologists to be protostomes, for example by Perez et al. (2014) The Chaetognatha: An anarchistic taxon between Protostomia and Deuterostomia (
 Myxozoa: placed as basal cnidarians according to Nesnidal et al. (2013) Agent of Whirling Disease Meets Orphan Worm: Phylogenomic Analyses Firmly Place Myxozoa in Cnidaria (
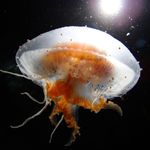 Anthozoa & Medusozoa Families placed according to Collins (2009) Recent Insights into Cnidarian Phylogeny (
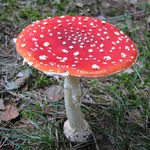 Holomycota (fungi etc.): The OpenTree has been used to fill out all the high-level fungal groups: Discicristoidea (placed at the base), Neocallimastigomycetes, Chytridiomycetes, Blastocladiomycota, Mucoromycotina, Ascomycota, Basidiomycota, Glomeromycota, Entomophthoromycota, Kickxellomycotina, Zoopagomycotina.
 Cryptomycota and Microsporidia: these group together, according to James et al. (2013) Shared signatures of parasitism and phylogenomics unite Cryptomycota and microsporidia (
 Microsporidia and allies are the deepest branching group in the fungi, followed by the Chytridiomycota, according to Capella-Gutiérrez et al. (2012) Phylogenomics supports microsporidia as the earliest diverging clade of sequenced fungi (
 Entomophthoromycota are placed as an outgroup to Kickxellomycotina + Zoopagomycotina as a result of Gryganskyi et al. (2012) Molecular phylogeny of the Entomophthoromycota (